
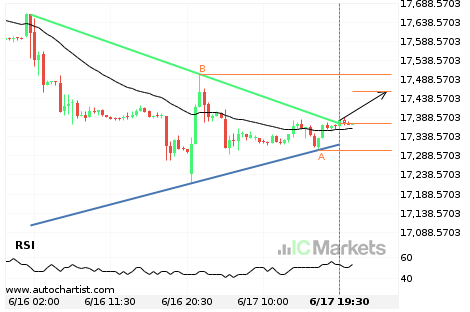
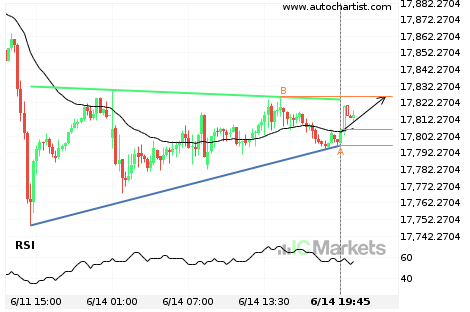
Big movement expected on FTSE China A50 Index
FTSE China A50 Index has broken through a resistance line of a Triangle and suggests a possible movement to 17457.6181 within the next 11 hours. It has tested this line in the past, so one should probably wait for a confirmation of this breakout before placing a trade. If the breakout doesn’t confirm, we could […]
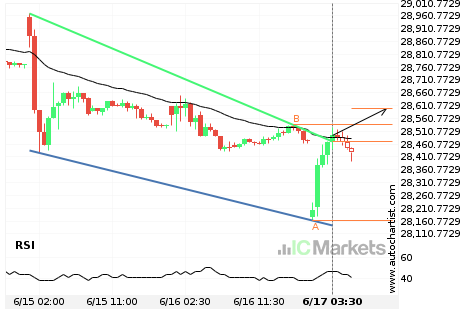
Hong Kong 50 Index has broken through resistance
Hong Kong 50 Index has broken through the resistance line of a Falling Wedge. It has touched this line at least twice in the last 3 days. This breakout indicates a potential move to 28600.7255 within the next 7 hours. Because we have seen it retrace from this positions in the past, one should wait […]
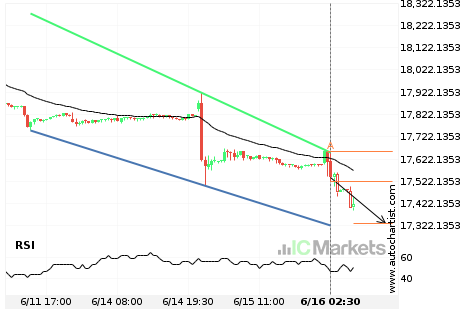
Will FTSE China A50 Index have enough momentum to break support?
FTSE China A50 Index is heading towards the support line of a Falling Wedge and could reach this point within the next 11 hours. It has tested this line numerous times in the past, and this time could be no different from the past, ending in a rebound instead of a breakout. If the breakout […]
Either a rebound or a breakout imminent on Hong Kong 50 Index
Hong Kong 50 Index is heading towards the support line of a Channel Down. If this movement continues, we expect the price of Hong Kong 50 Index to test 28418.1000 within the next 2 days. But don’t be so quick to trade, it has tested this line numerous times in the past, so this movement […]
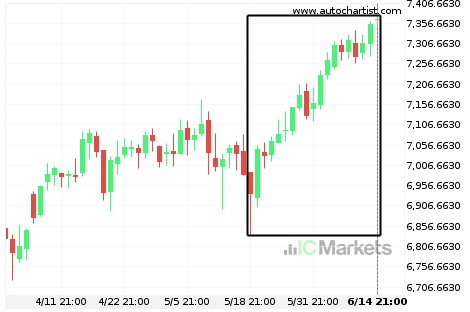
Australia 200 Index experienced an exceptionally large movement
For those of you that don’t believe in trends, this may be an opportunity to take advantage of an exceptional 6.22% move on Australia 200 Index. The movement has happened over the last 28 days. For those trend followers among you, you may think about riding this trend.

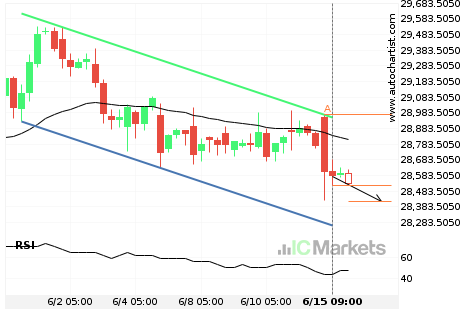
FTSE China A50 Index – getting close to resistance of a Triangle
FTSE China A50 Index is moving towards the resistance line of a Triangle. Because we have seen it retrace from this line before, we could see either a break through this line, or a rebound back to current levels. It has touched this line numerous times in the last 4 days and may test it […]

Will Australia 200 Index have enough momentum to break resistance?
Australia 200 Index is heading towards the resistance line of a Channel Up and could reach this point within the next 3 days. It has tested this line numerous times in the past, and this time could be no different from the past, ending in a rebound instead of a breakout. If the breakout doesn’t […]